

Technologies

EV charging station business case modelling

Public, or on-demand, EV charging is offered on-street, in car parks and at forecourts, often with high-powered DC fast chargers. Gridcog models when drivers arrive and how much they charge, with the grid connection, tariffs, on-site solar and battery storage, so you can test the business case for a charging hub before you build it.

  • Fast chargers' power demand can easily exceed 10–20 times a site's normal load; Shell's e-mobility team modelled hundreds of forecourt scenarios in Gridcog to size chargers and battery storage.

  • Five 50 kW chargers would have pushed a Utrecht supermarket's peak demand to 234 kW on a 150 kW connection; a 200 kWh / 100 kW battery kept it under the limit.

  • Across 1,950 network tariffs with demand charges in the Gridcog Library, the median annual demand charge for a 1 MW load was about €47k.

What is public EV charging?

Public EV charging, also called on-demand charging, is charging any driver can use: on-street, in car parks, at forecourts and at shops. Many sites use high-powered DC fast chargers for rapid charging. The operator can't know exactly when drivers will arrive, so a charging station's business case rests on how well the chargers are used.

Public (on-demand) chargingFleet and depot charging
Who chargesAny driverThe operator's own vehicles
When vehicles arriveUncertain, so Gridcog models arrivals probabilisticallyKnown from each vehicle's schedule
Can charging move to cheaper times?No: vehicles charge when they arriveYes: smart charging shifts it within the schedule
Where the money comes fromThe price drivers pay per kWhLower fuel and energy costs
Typical sitesForecourts, car parks, on-street and retailDepots, workplaces and homes

How does Gridcog model a public charging station?

As part of the site, interval by interval. Driver arrivals, the chargers, the site's existing load, the grid connection and any solar or battery sit in one simulation, with the tariffs and prices that decide whether the station pays.

01

Driver arrivals and queueing

Set how many charges a day the site expects, the energy per charge and when drivers are most likely to arrive. Gridcog simulates arrivals probabilistically at full interval resolution, with queueing when every charger is busy.
02

Chargers

Set charger size, number of chargers and a total charger power limit. Each vehicle charges at the lower of the charger's power and the vehicle's own maximum charging rate.

03

Utilisation growth

Increase charges per day in later periods of the schedule, as more drivers go electric or find the site, and add chargers with later start dates. See how the cashflows change as use grows.

04

Charging prices and costs

Set the price drivers pay per kWh, including time-of-use rates, and add charger capex and opex from rate cards. Energy supply and network tariffs, including demand charges, sit against it.

05

Grid connection, solar and storage

Apply the site's import limit, including dynamic schedules, and add on-site solar or a battery to keep charging peaks under the limit and cut network demand charges.

06

Results

Compare cashflows, internal rate of return (IRR) and net present value (NPV) for each stakeholder, such as the charge point operator and the site owner, with interval-level energy flows.

Modelled in Gridcog

Can you add rapid chargers to a site with a small grid connection?

Often, with a battery. In Gridcog Chief Product Officer Pete Tickler's model of a supermarket near Utrecht, five 50 kW chargers would have pushed peak demand to 234 kW on a 150 kW connection. A 200 kWh / 100 kW battery kept peak demand under the limit, without waiting for a grid upgrade.

Supermarket on the outskirts of Utrecht, the Netherlands

Site
150 kW grid connection; existing peak demand of 110 kW
Chargers
5 × 50 kW chargers for shoppers, used at random during opening hours
Effect
Peak demand up by around 130 kW, reaching 234 kW in one modelled week
Options
Fewer or slower chargers; a bigger connection from the network operator, Stedin, which can take several years in congested areas; or a battery
With a battery
A 200 kWh / 100 kW battery charged when the site was quiet and discharged when the chargers ran, keeping peak demand below 150 kW
Not included
The cost comparison, which depends on the battery's cost, local tariffs and how long an upgrade would take

Planning a charging hub or destination charging?

Model your charging site in Gridcog

How much do network demand charges cost a charging site?

Fabian Le Gay Brereton

CEO

It varies widely. Across 1,950 tariffs with demand charges, from 119 networks in 28 countries in the Gridcog Library, the median annual demand charge for a 1 MW load was about €47k. The 90th percentile was about €159k, and the highest about €624k.

Demand charges matter for charging sites because fast chargers create sharp peaks. The charges can depend on time-of-use windows, seasonal peaks, contracted capacity, excess-demand penalties and ratchets. Under Ausgrid's EA305 tariff in Australia, for example, a single 30-minute peak can raise network costs for the next 12 months. Gridcog models each tariff's rules and optimises any battery or solar on the site against them.

Network demand charges: how tariff complexity affects the flexibility business case

Which charging operators use Gridcog?

Truck charging networks and energy majors use Gridcog to plan charging sites. Two have published how.

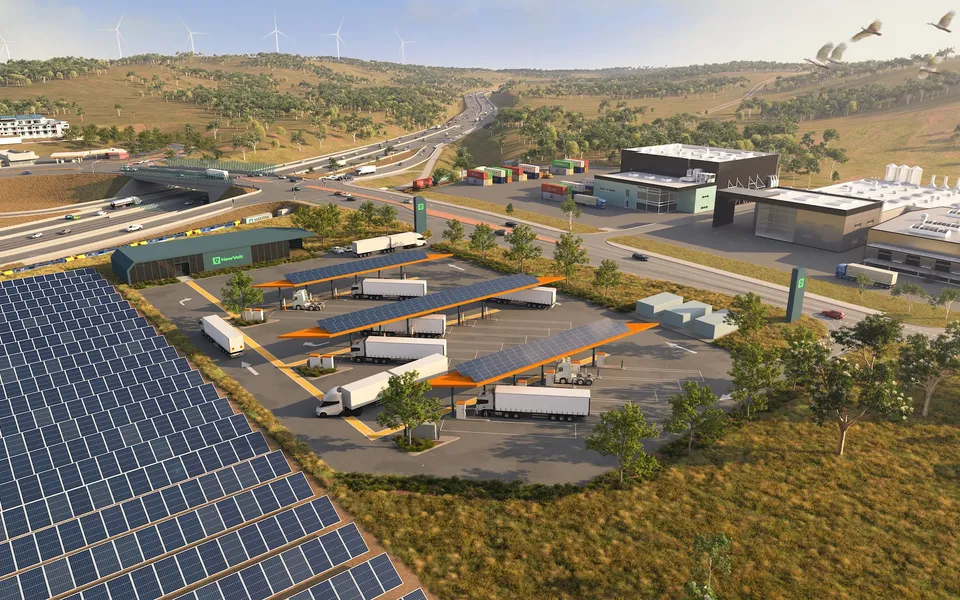
Rendering of an electric truck charging hub beside a motorway
Shared-use electric truck charging, Australia

NewVolt

Modelled more than 25 customer charging schedules, sized battery storage for each site and tested grid connection scenarios for three 2–4 MW hubs in the Melbourne Electrified Freight Network.

‘What used to take us days of spreadsheet modelling and manual scenario testing now takes hours.’
Rainer Knobloch, Co-Founder and COO
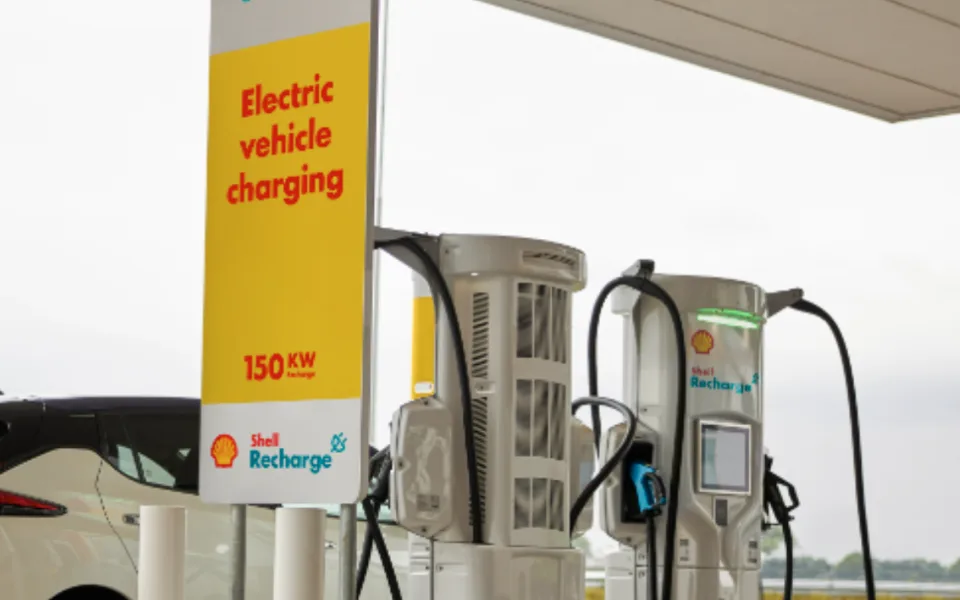
Shell Recharge fast chargers on a forecourt
Forecourt and fleet charging, the Netherlands

Shell

Shell's e-mobility team modelled hundreds of forecourt scenarios with fast chargers and battery storage for peak shaving, plus revenue from grid balancing and ancillary services such as aFRR and FCR. Small changes to site design could strengthen a project's business case.

Who models charging stations in Gridcog?

Charge point operators, fleet operators, energy majors with forecourt networks, and large energy users adding chargers for customers and staff.

Frequently asked questions

Enough to serve expected drivers without long queues, within what the grid connection allows. Gridcog simulates driver arrivals probabilistically, with queueing, so you can test the number and power of chargers against utilisation, revenue and connection limits. You can also raise charges per day in later years, as demand grows.

It depends on utilisation, the price charged per kWh, energy and network costs, and capex. Network demand charges can be a large share of costs: the median across 1,950 tariffs in the Gridcog Library was about €47k a year for a 1 MW load. Gridcog models these together, with any on-site solar and storage, to show cashflows, IRR and NPV.

Yes, on many sites. A battery charges when the site is quiet and discharges when the chargers run, so the site's net demand stays under its connection limit. In Pete Tickler's Utrecht model, a 200 kWh / 100 kW battery kept a supermarket under its 150 kW limit after five 50 kW chargers were added.

The expected charges per day, energy per charge and likely arrival times; charger size and number; the site's existing load and grid connection limit; energy supply and network tariffs; the price drivers will pay; and charger capex and opex. Add solar and battery details if you want to test them too.

A battery at the hub can. Shell's e-mobility team used Gridcog to model revenue from grid balancing and ancillary services, such as aFRR and FCR, using fast chargers and batteries, alongside network tariff optimisation. Gridcog co-optimises the battery's charging and market participation with the chargers' demand.

Yes. NewVolt used Gridcog to plan shared-use charging hubs for electric trucks in Melbourne, modelling more than 25 customer charging schedules and sizing battery storage and grid connections for three 2–4 MW sites. Hubs serving known fleets can use vehicle schedules, as for fleet and depot charging.

Request a live demo

Model your charging site in Gridcog

Request a demo and we'll show you how Gridcog builds the business case for your charging station.

The team behind Gridcog

Fabian Le Gay Brereton, Chief Executive Officer and Co-Founder of Gridcog

Fabian Le Gay Brereton

Chief Executive Officer & Co-Founder

Previously co-founded Greensense, acquired by ERM Power (now Shell Energy).

Pete Tickler, Chief Product Officer and Co-Founder of Gridcog

Pete Tickler

Chief Product Officer & Co-Founder

Co-founded Greensense and led digital innovation at ERM Power (now Shell Energy).

Genna Boyle, Chief Commercial Officer and Head of EMEA at Gridcog

Genna Boyle

Chief Commercial Officer & Head of EMEA

More than 10 years in energy strategy, trading and renewables, with senior roles at Battery Optimiser and Limejump.