

Technologies

Solar PV simulation software

Solar PV systems generate electricity directly from solar irradiance, and their output depends on location, local weather, module and inverter characteristics, and orientation and tilt. Gridcog simulates that output with site weather data, then values it against market prices, negative prices, curtailment and network tariffs, at utility scale or on a commercial site.

What is solar PV simulation?

Solar PV simulation estimates how much electricity a solar system will generate in each interval, from the site's weather, the modules and inverters, and how they're mounted. For a business case, that output then has to be valued against the prices, tariffs, curtailment and contracts the system will actually face.

What affects a solar system's output?

FactorWhat Gridcog uses
Location and weatherIrradiance, cloud, air temperature, albedo and wind speed for the site, at 2 km resolution
Orientation and tiltThe array's azimuth and tilt angle
MountingRooftop, fixed ground mount, or single-axis tracking with a maximum tilt angle, backtracking and ground coverage ratio
Modules and invertersThe DC to AC ratio between module and inverter capacity (1.2 by default)
Losses and degradationA losses factor (11% by default) and yearly degradation

How does Gridcog model a solar project?

Interval by interval, from yield to cashflow. Gridcog calculates the system's output from the site's weather data, then dispatches it against the grid connection, prices, tariffs and any battery or load on the site, so the solar farm's value reflects what it will really earn.

01

Yield from site weather data

Gridcog's built-in solar model uses Solcast weather data for the site and the open-source PVLib library to calculate output, interpolated to 30-minute intervals. Or upload your own generation profile, for example from PVsyst, as an externally modelled asset.

02

System design

Set orientation, tilt and mounting, including single-axis tracking with backtracking, the DC to AC ratio, losses and degradation. Add capacity on future dates to model a phased build or repowering, and compare sizes side by side.

03

Economic curtailment

In co-optimised mode, the solar system turns down when exporting would cost money, for example during negative prices or when export charges outweigh revenue. Where certificates such as Australia's large-scale generation certificates (LGCs) add value, you can set them up so the curtailment threshold moves to match.

04

Grid connections and network curtailment

Apply export and import limits, flexible connections and network curtailment schedules, and see how much output the connection limit costs. Test a smaller connection with a battery against a larger one without.

05

Batteries and co-located load

Add an AC-coupled or DC-coupled battery. For DC-coupled systems, Gridcog calculates DC clipping and efficiency losses and uses that energy to charge the battery. Add on-site load, EV charging or other assets on the same connection.

06

Commercial models

Model merchant exposure, power purchase agreements (PPAs), including behind-the-meter PPAs, subsidies, certificates, export tariffs and self-consumption savings, then compare cashflows, internal rate of return (IRR) and net present value (NPV) for each stakeholder.

Modelled in Gridcog

Can a standalone solar farm still make money?

Often not, in markets like Victoria. Gridcog Senior Energy Analyst Scott Bosman modelled a merchant solar farm in north-western Victoria over 20 years, alone and with a battery. The standalone farm finished about A$13m in the red; with a battery it made about A$42m, even after A$100m of extra hardware.

110 MWdc solar farm, north-western Victoria, Australia

Scenarios
Solar on its own; the same solar farm with a 50 MW / 4-hour battery
Prices
Merchant, on the last 12 months of Victorian wholesale prices, with imperfect foresight
Grid connection
50 MW import, 90 MW export
Costs and certificates
CSIRO GenCost capex for solar and battery; large-scale generation certificates (LGCs) until the end of 2030
Result
Standalone: about A$13m loss over 20 years. With a battery: about A$42m profit
Why
The battery shifts excess solar into higher-priced periods and earns arbitrage revenue
Not included
Marginal loss factors, ancillary services, grid congestion and contracted revenue

Testing a solar farm or adding storage to one?

Model your solar project in Gridcog

Why can typical-year weather data overstate solar revenue?

Pete Tickler

Chief Product Officer

Because the sunniest hours are now often the cheapest. A typical meteorological year (TMY) averages long-term weather, so it misses the link between very sunny days and negative prices. When Gridcog Chief Product Officer Pete Tickler ran the same Gridcog solar model in Victoria on TMY data and on actual 2023 irradiance, the actual-weather model generated much more on negative-price days.

That correlation matters more as solar grows. South Australia had around 2,300 hours of negative prices in 2023, over 25% of all price intervals, and Victoria had recorded nearly 1,500 hours in 2025 by the end of November, about four times more than five years earlier. A model that ignores it overstates the solar farm's capture price, the volume-weighted average price it earns for its output.

TMY overestimates solar revenue in high VRE markets

How big a grid connection does a solar farm need?

Fabian Le Gay Brereton

CEO

Often less than its peak output, with a battery. In a Gridcog model of a 300 MW solar farm in South Australia, adding a 300 MW, 2-hour battery and then halving the grid connection to 150 MW cut annual revenue by only 11% with an AC-coupled battery, and 20% with a DC-coupled one.

Two things explain it. Wholesale prices in peak solar hours averaged A$35/MWh, against a market average of A$132/MWh, so the output lost to a smaller connection was worth little. And the battery stored energy the connection couldn't export, then sold it when prices recovered.

Why BESS is more: solar development in a grid capacity constrained world

Where does behind-the-meter solar pay best in Europe?

Laura Hoffmann-Ostenhof

Central Europe Industry Lead

Not always the sunniest country. Gridcog Central Europe Industry Lead Laura Hoffmann-Ostenhof modelled the same supermarket, with 470 MWh of annual demand and a 300 kW connection, across nine European markets on the most recent 12 months of prices and tariffs (November 2025).

  • Solar only (300 kW): Italy saved the most, about €50,000 a year, followed by Ireland at €42,000 and the UK, despite lower solar yields in both, because of high daytime wholesale prices and avoided non-commodity charges.
  • Solar with a 500 kWh / 2-hour battery: Portugal moved to first place, saving roughly €60,000 a year, with over a third of the savings from avoided network demand charges.

Where's the best place in Europe for behind-the-meter solar and storage in 2025?

Which solar teams use Gridcog?

Developers, independent power producers (IPPs), technical advisors and commercial solar installers. Three have published how.

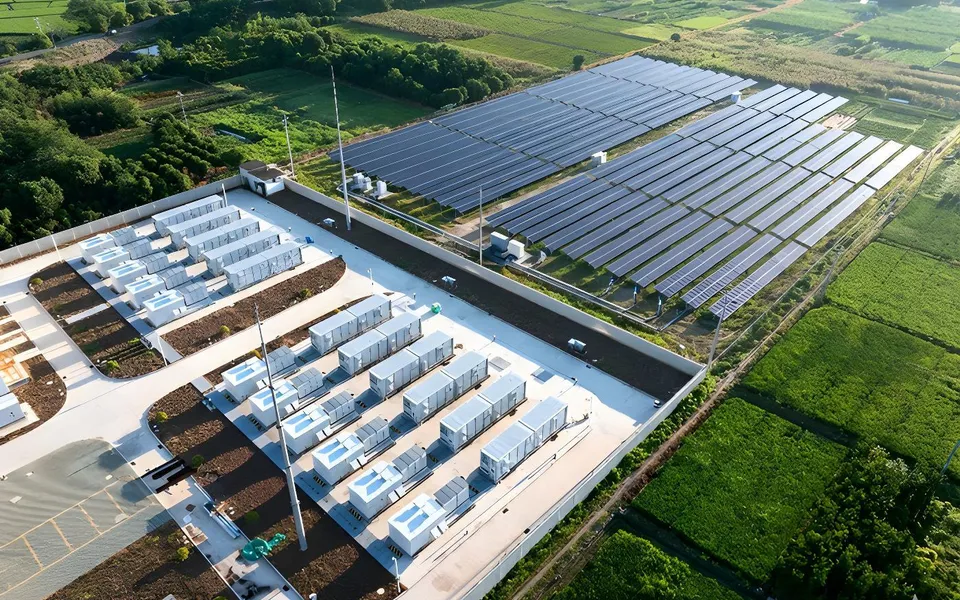
Battery storage containers beside a large solar farm
Technical consulting, Germany

meteocontrol

Compared storage sizes against the planned solar capacity for a 53 MWp solar and 120 MWh battery project in Saxony-Anhalt, across two construction phases.

‘Due to rapid market development, PV projects without BESS are essentially no longer being built in Germany.’
Peik Uhr, Senior Business Development Manager for Technical Consulting
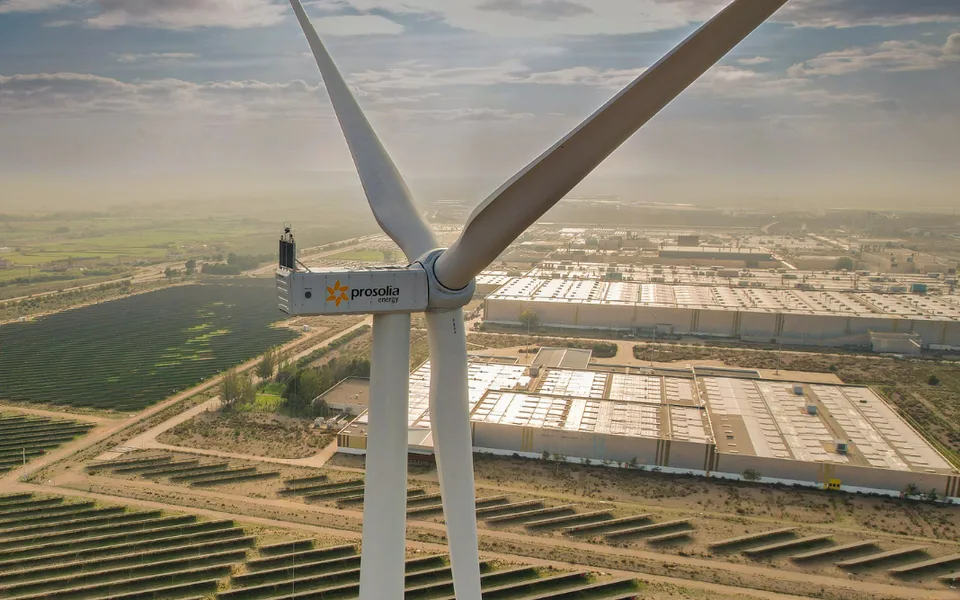
A wind turbine beside a large solar farm
Independent power producer, Spain, Portugal, France, Italy, Germany and Mexico

Prosolia Energy

Develops utility-scale solar and hybrid systems, and has modelled more than 200 projects in Gridcog, at least ten times faster than with in-house tools.

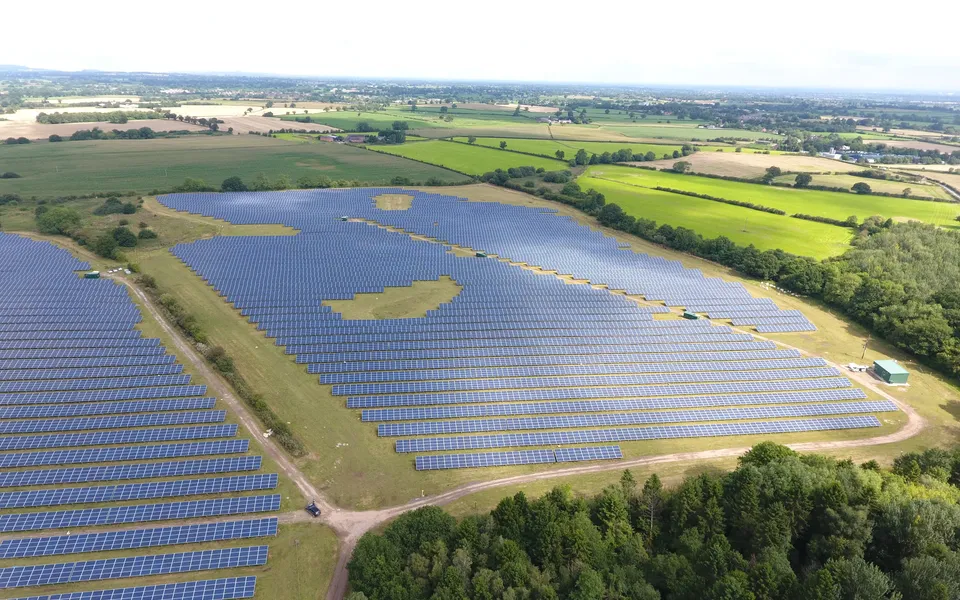
Aerial view of a solar farm in the UK countryside
Behind-the-meter solar and storage, UK

Sustain Commercial Solar

Delivers around 4 MW of solar and 12 MWh of battery storage a month for UK businesses, including 450 kW of rooftop solar with a 2.5 MWh battery at Linear Plastics in Wales.

Frequently asked questions

Solcast data for the site's location, including irradiance, cloud opacity, air temperature, albedo and wind speed, at 2 km resolution. Gridcog's built-in model calculates output from it with the open-source PVLib library, interpolated to 30-minute intervals across the project's life. You can also upload your own yield profile instead.

Yes. Upload your PVsyst output, or any third-party yield profile, as an externally modelled asset. For a DC-coupled battery, the upload template has a column for the DC energy that's available to charge the battery but isn't exported, which in PVsyst terms is typically EAvlDC minus EOutInv.

Yes. Choose ground mount with tracking, and the panels follow the sun from east to west. You can set the maximum tilt angle, turn on backtracking so panels tilt back to avoid shading each other, and set the ground coverage ratio, the share of the site's ground area the array covers.

They hit when solar generates most. In Victoria, negative prices coincide with peak solar output, and the state had recorded nearly 1,500 hours of them in 2025 by the end of November. Gridcog values every interval of output at the price it would actually earn, curtails economically when exporting would lose money, and tests how storage or co-located load changes the result.

It depends on the site and its contracts. Pete Tickler looked at five operating solar farms in Australia's National Electricity Market (NEM): adding a 50 MW, 2-hour battery could increase revenue by 100% to 400% under perfect conditions. Operational batteries in the NEM capture more like 60% of perfect-foresight value, so model the battery with forecast uncertainty too.

Yes. Model rooftop or ground-mounted solar at a business with its load, grid connection, supply contract and network tariffs, and value self-consumption, exports and any battery. In Laura Hoffmann-Ostenhof's European comparison, the same supermarket's savings varied from country to country more with tariffs and daytime prices than with solar yield.

Request a live demo

Model your solar project in Gridcog

Request a demo and we'll show you how Gridcog simulates your solar project, from yield to cashflow.

The team behind Gridcog

Fabian Le Gay Brereton, Chief Executive Officer and Co-Founder of Gridcog

Fabian Le Gay Brereton

Chief Executive Officer & Co-Founder

Previously co-founded Greensense, acquired by ERM Power (now Shell Energy).

Pete Tickler, Chief Product Officer and Co-Founder of Gridcog

Pete Tickler

Chief Product Officer & Co-Founder

Co-founded Greensense and led digital innovation at ERM Power (now Shell Energy).

Genna Boyle, Chief Commercial Officer and Head of EMEA at Gridcog

Genna Boyle

Chief Commercial Officer & Head of EMEA

More than 10 years in energy strategy, trading and renewables, with senior roles at Battery Optimiser and Limejump.