Retrofitting a BESS to the Wemen Solar Farm in Victoria
The Australian electricity sector’s transition to high-share renewables is well underway, with records seemingly broken every other week. But with every transition, there are always growing pains. In this case, those growing pains are economic and physical curtailment.
Just how big of a problem do renewable generators face, and how can they minimise their commercial risk?
We will be zooming in on a real-life asset, the Wemen Solar Farm in Victoria, Australia. We will analyse how curtailment is the new reality for generation assets and explore how adding battery energy storage systems (BESS) to standalone generation can unlock significant further value.
Here’s Scott’s full video on the topic:
The Rise of Economic Curtailment
Economic curtailment occurs when assets stop generating because it is no longer profitable, typically when wholesale electricity prices turn negative. Negative pricing is a feature of most power markets with a high renewable share. It is especially pronounced in Australia’s National Electricity Market (NEM) due to price cannibalisation from the world’s highest penetration of rooftop solar.
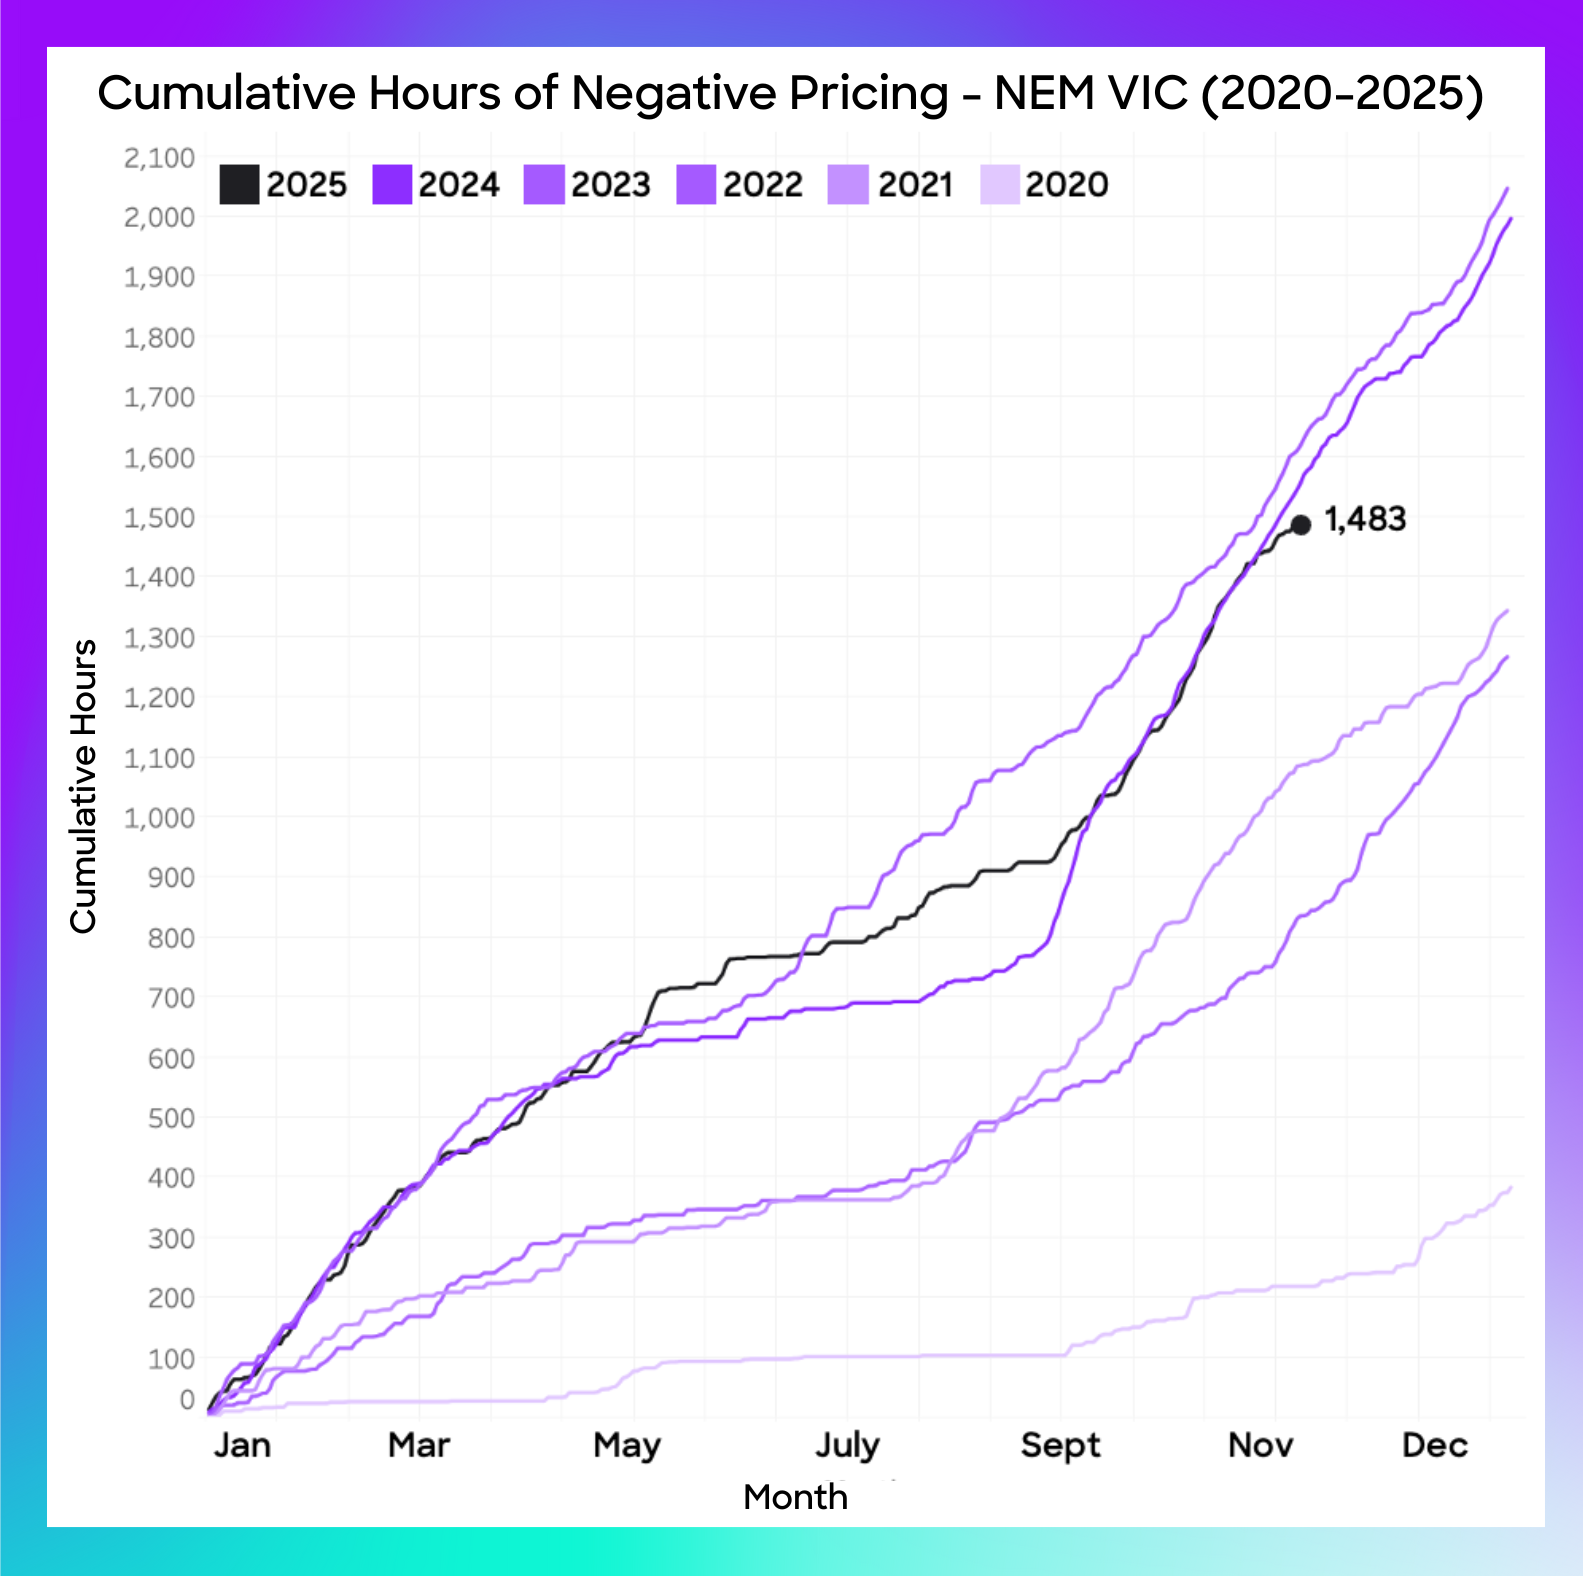
Cumulative hours of negative prices in Victoria have surged over the past five years. The year 2025 has already seen nearly 1,500 hours, which is equivalent to roughly two months of negative pricing. But how does Victoria compare to its international counterparts?
.png)
Victoria has experienced nearly ten times more cumulative negative pricing hours than the UK in 2025, comparable to the figures for Germany, Spain, and France combined.
Analysing a Live Asset: Actual vs. Available Generation
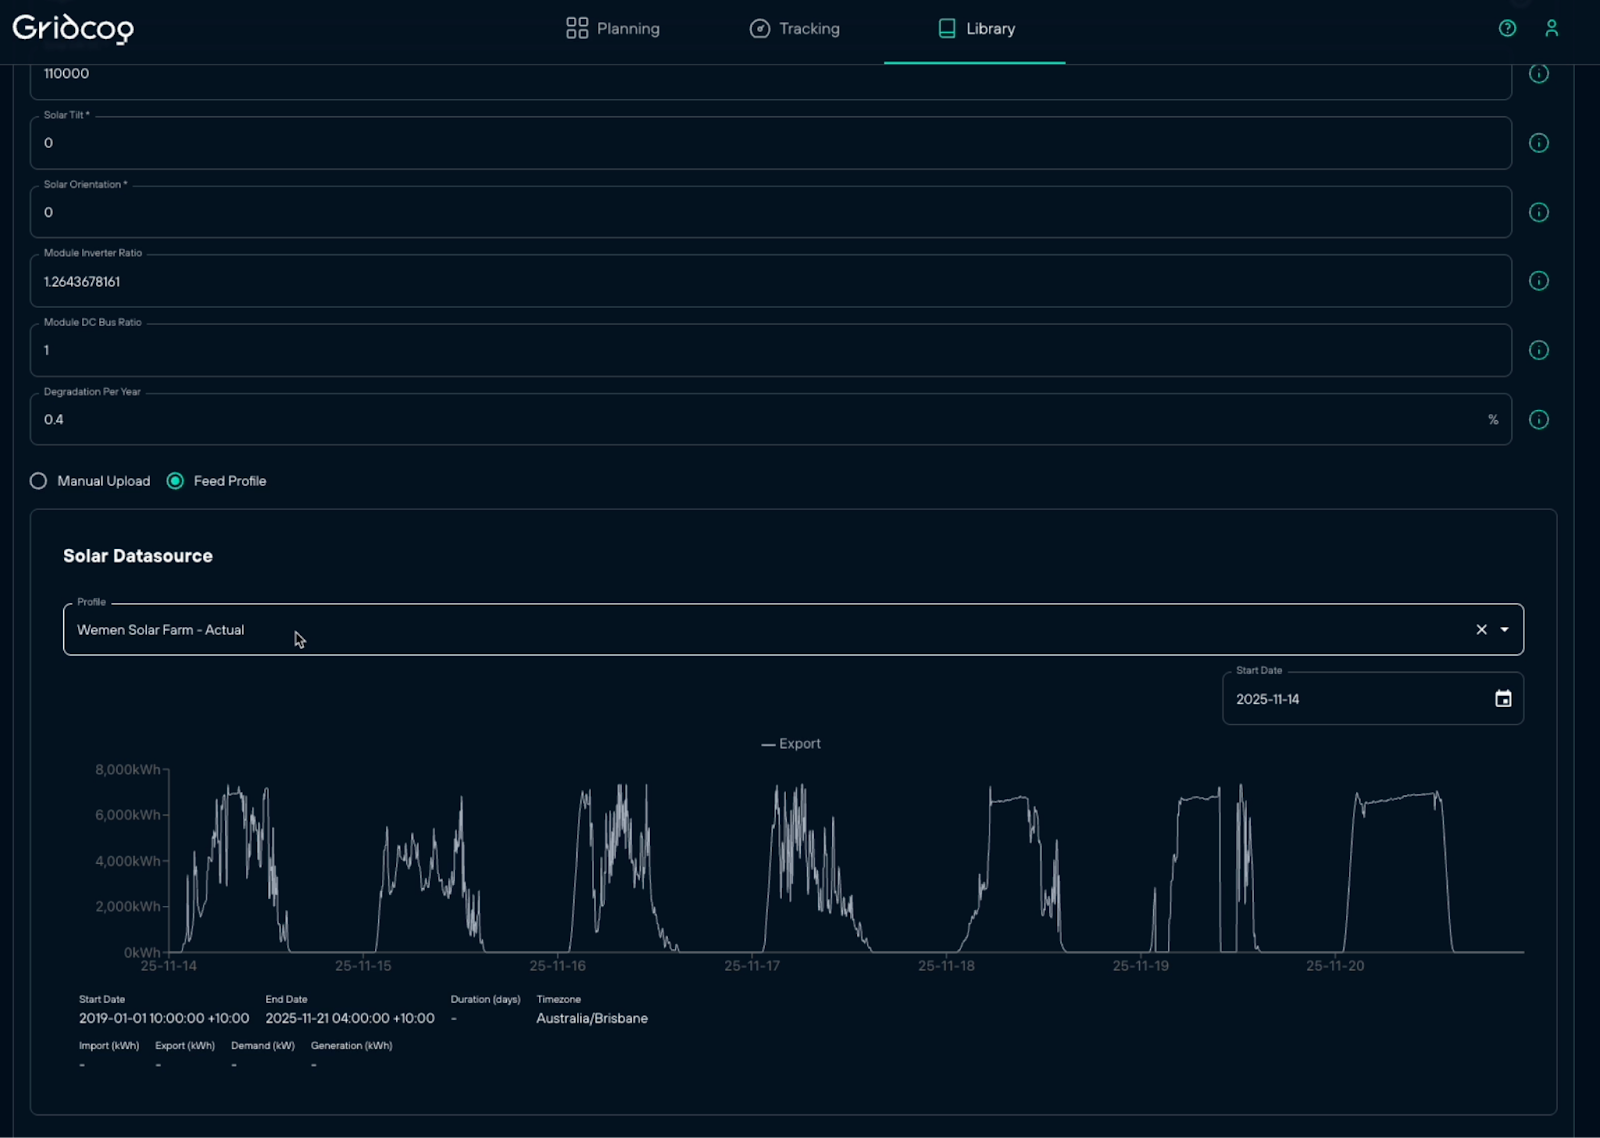
To visualise how curtailment affects real-life assets, we configured a live feed of 5-minute generation data for the 110MW Wemen Solar Farm in Victoria, modelling pure merchant behaviour over the last 12 months.
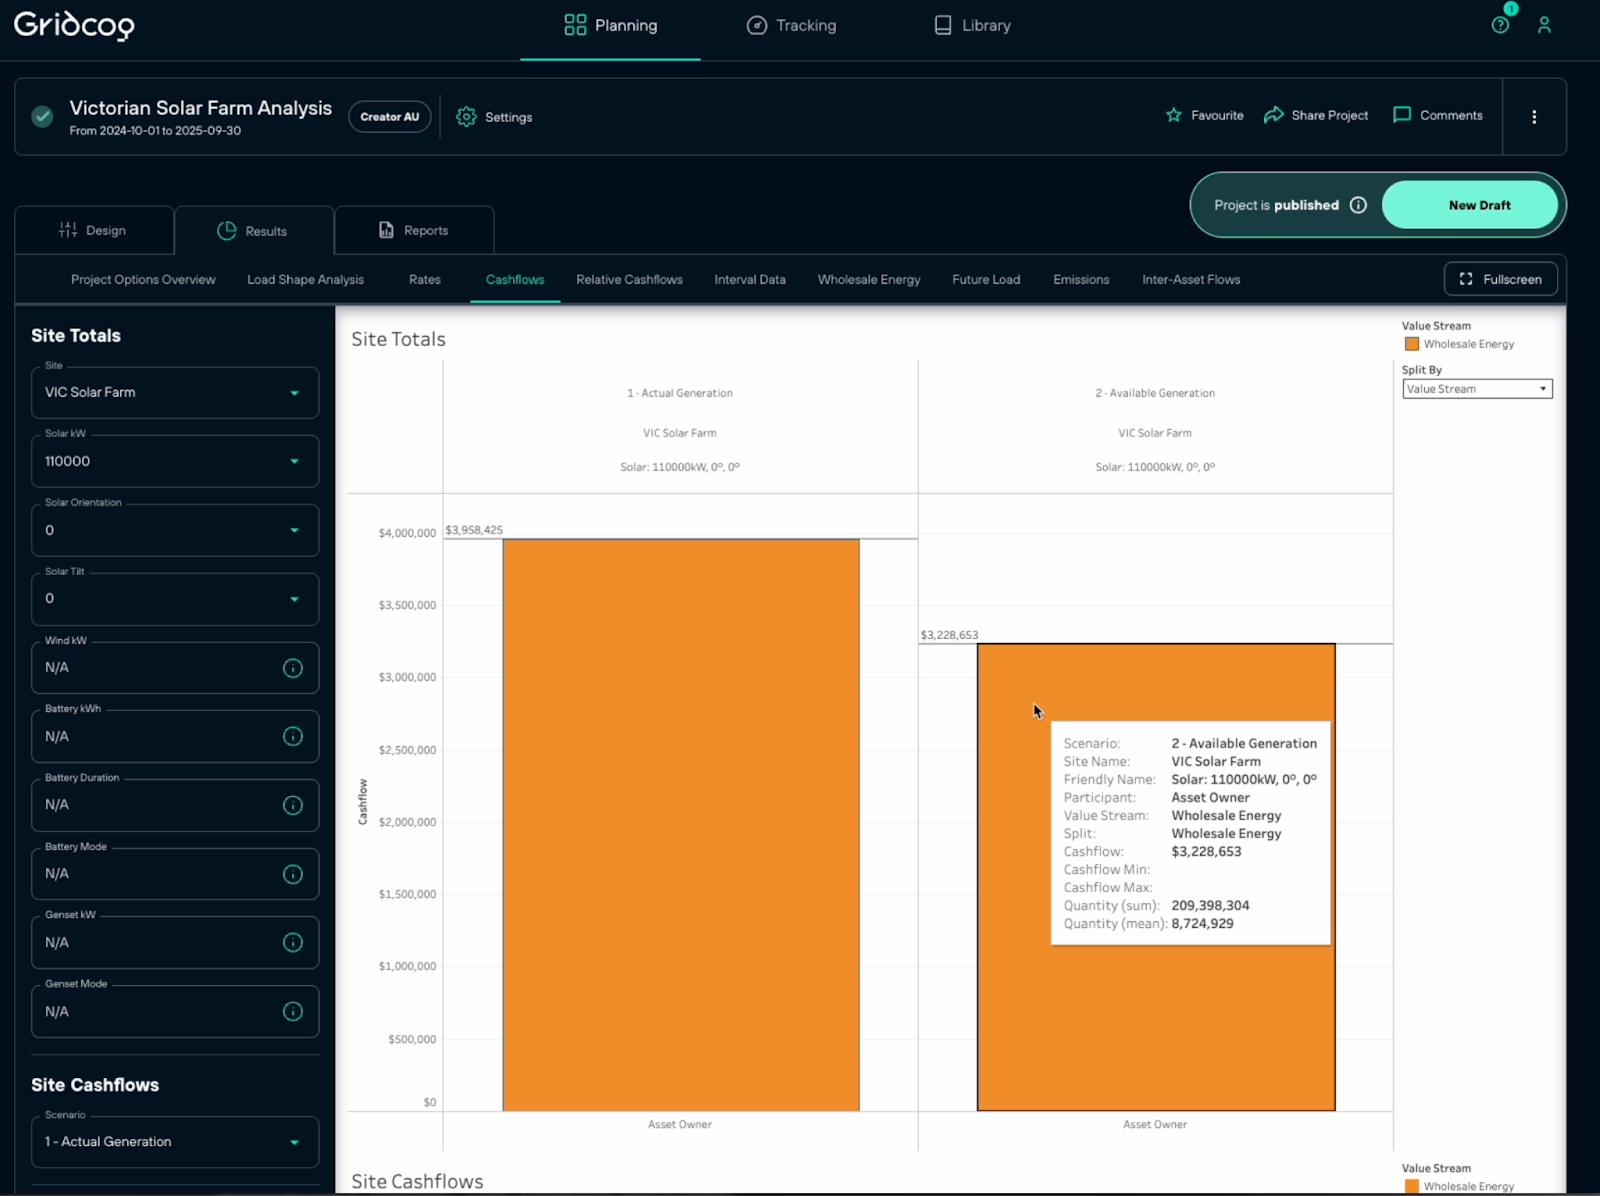
We established two baselines to understand the site's performance:
- Scenario 1 (Actual Generation): What was actually sent out to the grid.
- Scenario 2 (Available Generation): What could have been sent out to the grid.
The difference between these two scenarios reflects both economic and physical curtailment.
The Results: After running the simulation for the last 12 months, we found that only 76% of the available generation was actually sent out to the grid. The difference in generation is roughly 50GWh. This is the volume curtailed either due to economic reasons like negative pricing, or physical reasons such as grid constraints.

Interestingly, if all of the available pre-curtailment generation was actually sent out to the grid, the solar farm would have made $700k less over the last 12 months, despite exporting 1.3 times more volume.
Auto-Sizing a Battery to Maximise Returns
To combat this loss of potential generation, an asset owner might explore adding a BESS to the site. But how do we know how big the battery should be?
Rather than rely on guesses, Gridcog can automatically search for the optimal combination and sizing of co-located solar, wind, and battery assets to maximise project cash flows. We call this process auto-sizing.
For this assessment, we modelled a third scenario: the addition of an auto-sized 4-hour battery to the site’s available generation. To constrain the asset sizing recommendations, we applied:
- CSIRO GenCost pricing.
- An assumed grid import augmentation cost of $500k per MW.
- The last 12 months of pricing data, projected over a 20-year lifespan.
- Co-optimised dispatch of the battery and solar turndown.
The Auto-Sizing Results: Our auto-sizing tools determined the optimal size of a 4-hour battery for this site was around 163MW.
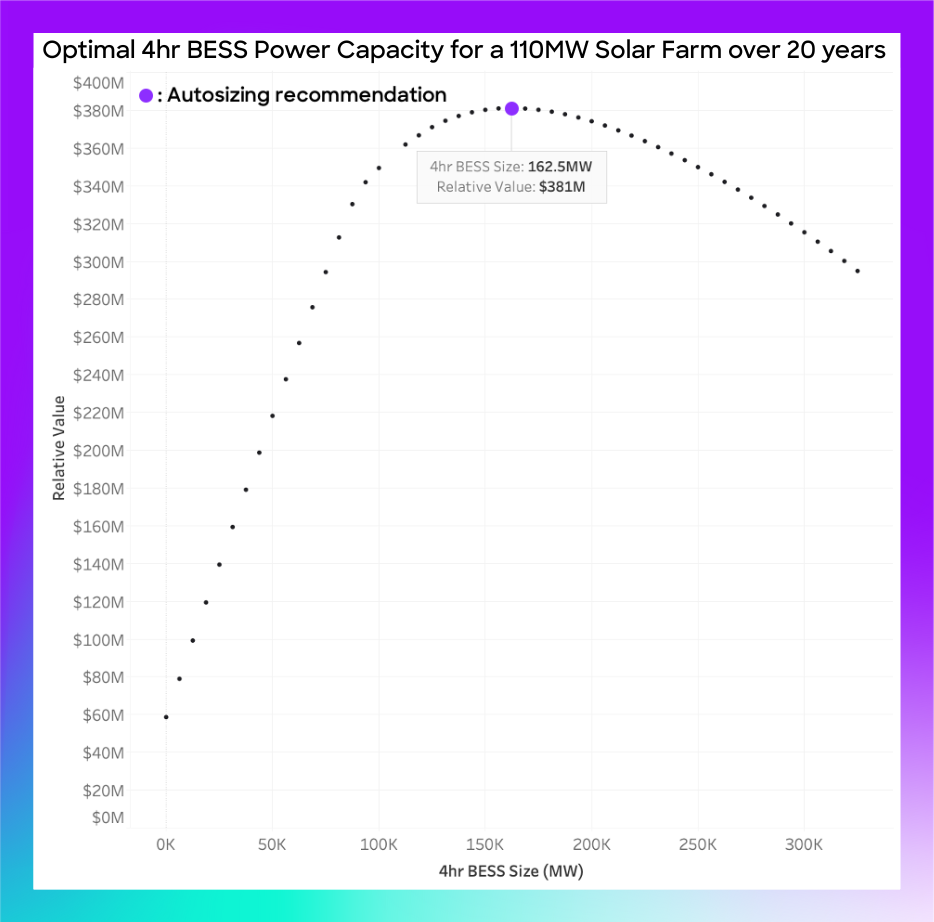
As the chart demonstrates, a grid search of various battery sizes verifies this recommendation, with the auto-sized result hitting the exact apex of possible value captured.
The Impact of BESS on Solar Generation Flows
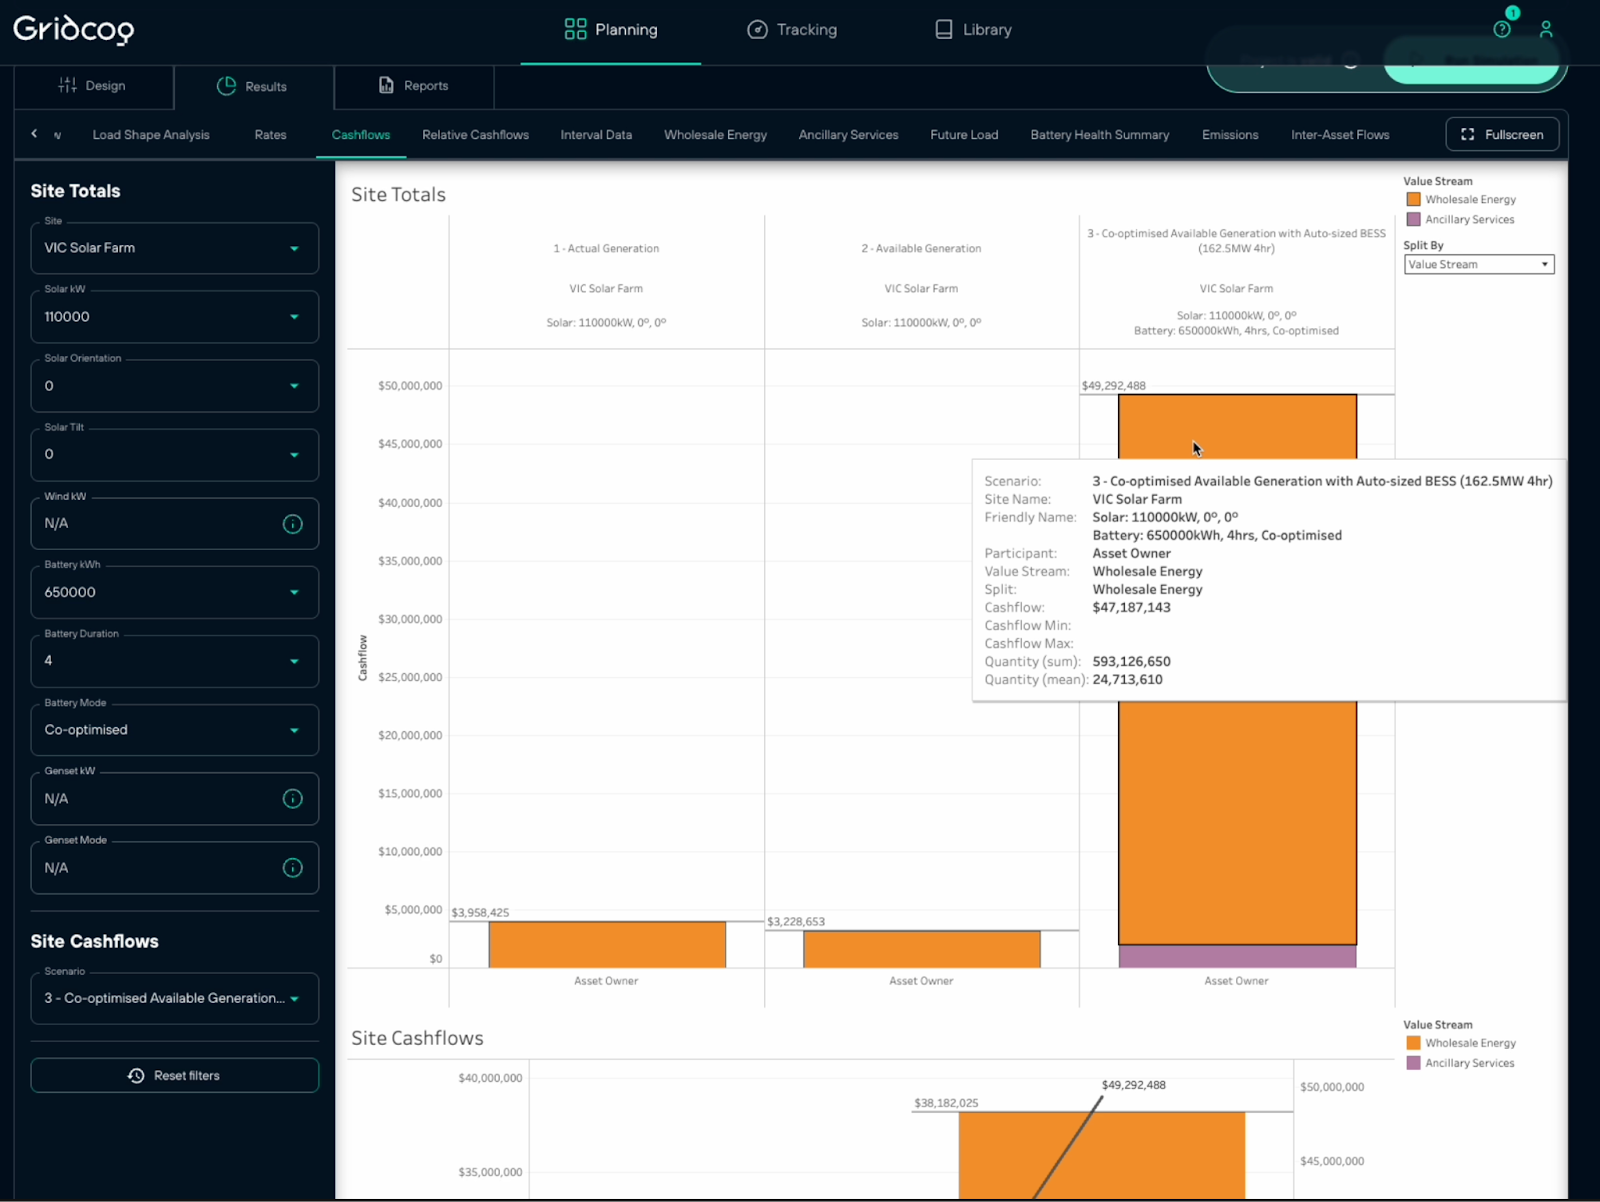
Confident with our asset sizing, we ran a revenue-only model using the recommended 163MW battery for the last 12 months. Expectedly, the new scenario greatly increases site revenues.
But to what extent has the addition of a battery altered the actual flow of solar generation?
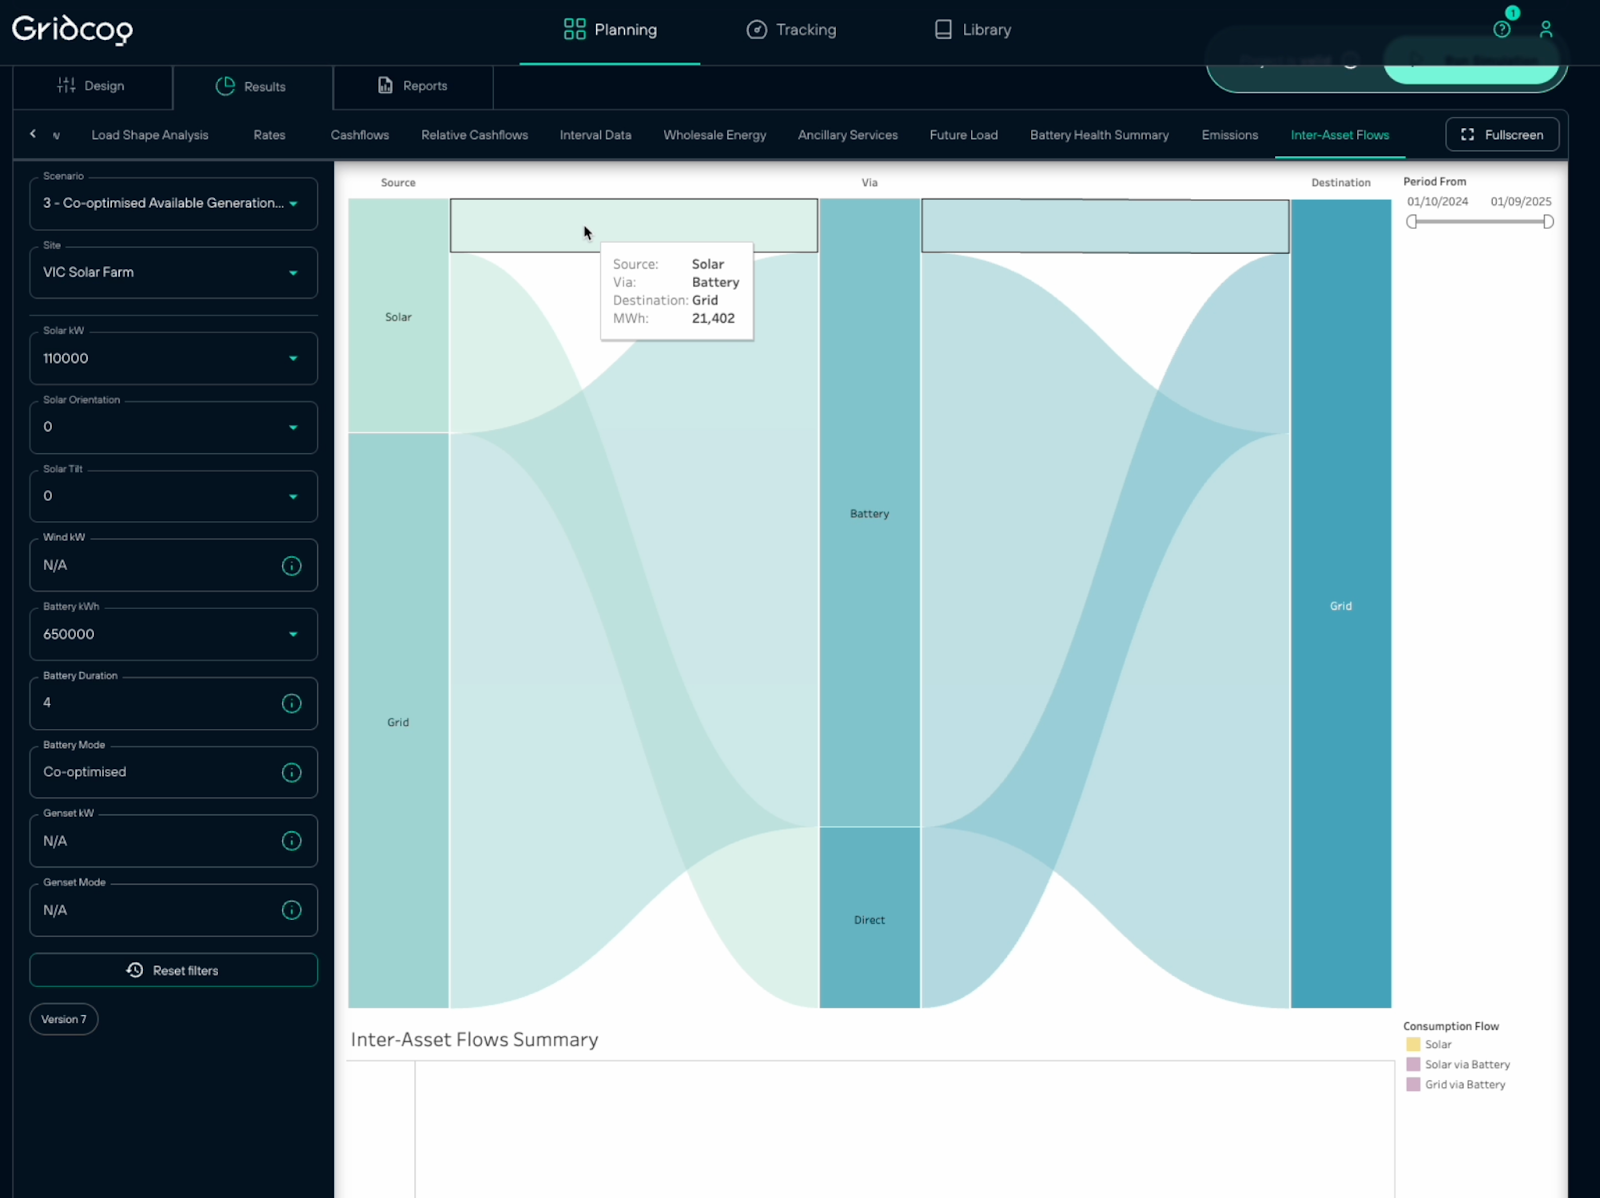
Looking at the inter-asset flows, we can see that 21GWh, or 23% of the solar exports, are directed straight to the battery. The BESS stores that energy to export later at more optimal, non-negative pricing intervals.
While this is a best-case revenue model (with factors such as Marginal Loss Factors, grid constraints, and uncertainty not applied), it clearly highlights the opportunity for standalone generation to utilise storage to capture additional value from existing assets.
Factoring in Real-World Complexity
While this modelling focuses solely on merchant revenue, most renewable and storage projects also rely on contracted revenue streams such as Power Purchase Agreements (PPAs) or tolling arrangements.
In addition, a range of project and site-specific factors may influence long-term outcomes, including:
- Changing loss factors (MLFs).
- Future grid congestion.
- Increasing saturation of ancillary service markets (FCAS).
- The inclusion of long-term price forecasts.
Gridcog’s auto-sizing can take into account all of these complex factors when determining asset sizes, taking the guesswork out of renewable and battery storage project design.
Reach out to the team if you’re looking for a better way to model your energy projects.


