Solar Surges, Negative Prices & the Evolving Duck Curve in European Energy Markets
%20(1620%20x%201080%20px).jpg)
In the last week we’ve seen the solar generation record be broken twice in the GB market, with the most recent record being set on Monday 6 April at 12.68GW. Given the pace of the energy transition and solar deployment it’s largely unsurprising that these records tumble every Spring. However, what is interesting is the impact that the evolving duck curve is having on power prices and power price spreads across Europe.
Negative prices and why they occur
Simply speaking wholesale energy prices are a result of supply and demand. Higher demand results in more expensive generators needing to be dispatched, which in some markets still includes coal and diesel fired back up generators. The opposite happens when generation is over-supplied and exceeds demand, in these cases most renewable generators will not immediately curtail their output as prices fall below zero, this is primarily for economic reasons. Many renewable generators earn lucrative subsidy or green certificate payments, which still means they’re in the money if prices are below zero and some will be on feed in tariffs or PPAs that provide little to no incentive to curtail output. We saw this in action across Europe last weekend with prices trading below -€100/MWh.
The duck curve
A well known phenomena in energy markets with a high solar penetration is the ‘duck curve’ this is where demand is lower in the middle of the day as it is off-set by solar generation. With higher PV deployment we’re seeing this duck curve widen and apply to shoulder months as well. This graphic from Killian Daly gives a good depiction of how this has changed in Germany over the last 3 years, given Germany hopes to double installed PV by 2030, we only expect this to grow.
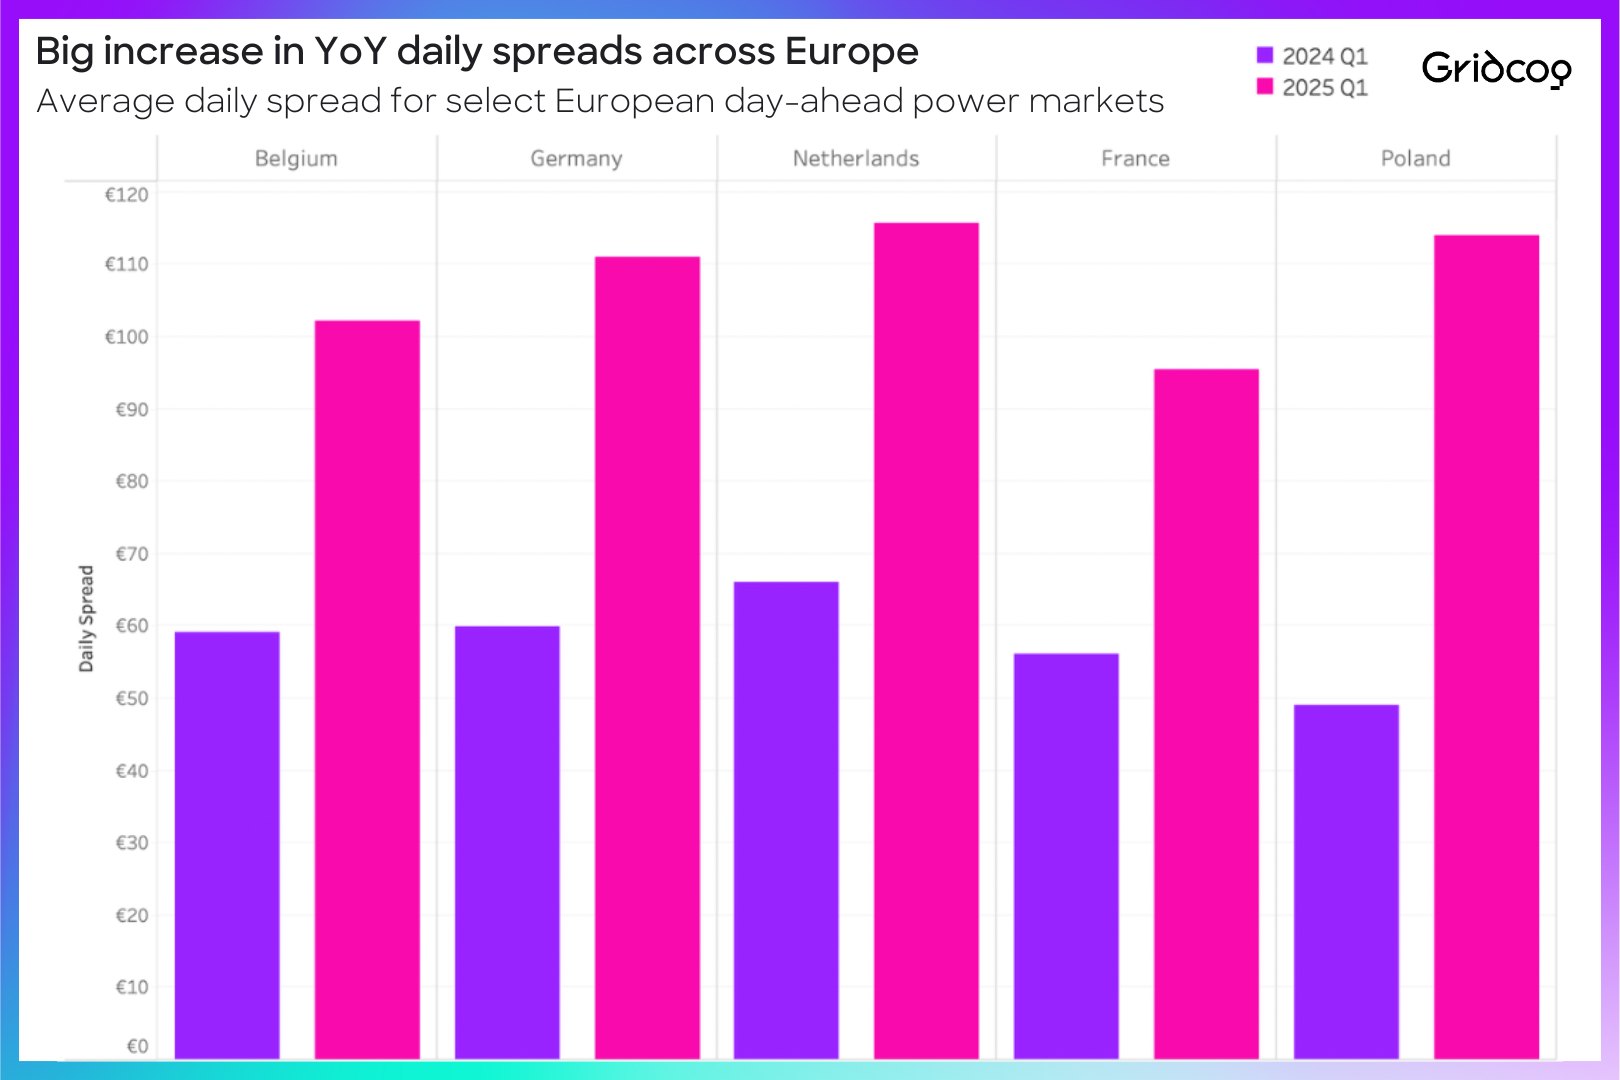
Price spreads in Europe
Changing supply and demand conditions are changing the fundamentals over power markets globally. This is playing out via the increase in negative pricing but also changing price spreads. Interestingly across many European markets Day Ahead Hourly price spreads have increased substantially between Q1 2024 and Q1 2025, with spreads in Poland up 130% with Germany close behind at 89%. Importantly, increased solar generation is not the only part of this story but it does play a role.
What does this mean for flexible generation assets?
Flat prices provide no incentive for flexible generation assets to do anything, whereas deeply negative or wide spreads provide an increasingly strong signal for flexible assets such as battery storage, EV fleets or flexible loads to respond. In cases where prices are negative these assets are effectively able to charge for free (or get paid to charge), this may be via a standalone optimisation strategy or via charging off excess onsite generation. Typically the strongest price signals come via wholesale energy markets as supplier tariffs tend to dampen them. This is where we think opportunities to optimise flexible generation assets using market mechanisms such as P415, P375, On Market Child Meters and NEBEF are exciting developments.


