How Accurate Are BESS FCAS Revenue Forecasts? Lessons from Australia’s Battery Markets
.jpg)
How Accurate Are BESS FCAS Revenue Forecasts? Lessons from Australia’s Battery Markets
In mature battery storage markets, like GB, Germany, ERCOT, and Australia’s NEM, we have seen a steady decline in ancillary services revenue as more battery energy storage systems have been deployed. While early movers in these markets made significant revenues from ancillary services, these markets are shallow and quickly become saturated.
Why FCAS Revenues Are Falling in Mature Battery Markets
I recently had the experience of meeting with a behind-the-meter battery developer who had been using a more naive solution for “feasibility studies” and for a recent behind-the-meter project in Australia had decided on a 30-minute duration battery with an expectation that more than 60% of the assets future revenues would come from providing ancillary services. With the trend towards 2, 3, and even 4-hour batteries this was a surprising conclusion.
The Problem with Simplistic BESS Feasibility Studies
More simplistic ‘feasibility studies’ tend to be reductive and assume that a battery can capture FCAS revenue proportional to battery capacity and ancillary service pricing: assuming that all battery capacity is available to be offered, and all offered capacity is accepted by the system operator.
Key Assumptions for Realistic FCAS Revenue Modelling
More realistic ancillary service modelling includes the following:
- Sensible assumptions on capacity registered and accredited to participate in markets
- Short-term forecasting uncertainty in relation to both energy and ancillary service pricing
- True co-optimised dispatch modelling for energy and ancillary, recognising that there can be opportunity costs associated with providing these services
- Headroom and footroom provisions to ensure the battery can offer the service for the required duration of enablement
- Ensuring bids are rounded to whole MWs of capacity, if that is required for the given market service
- Realistic assumptions on capacity being procured by the system operator and what percentage of offered capacity will be accepted/enabled (including the ability to express a view on how that might decline in the future; see this week’s Product Corner)
- Realistic assumptions about the energy utilisation associated with dispatch of the enabled capacity by the system operator
Case Study: Optimistic vs Realistic FCAS Revenues in Queensland
To illustrate the importance of more realistic and accurate modelling, we have compared a simplistic and a realistic forecast of FCAS revenue for a behind-the-meter project and a front-of-meter project in Queensland in the chart below.
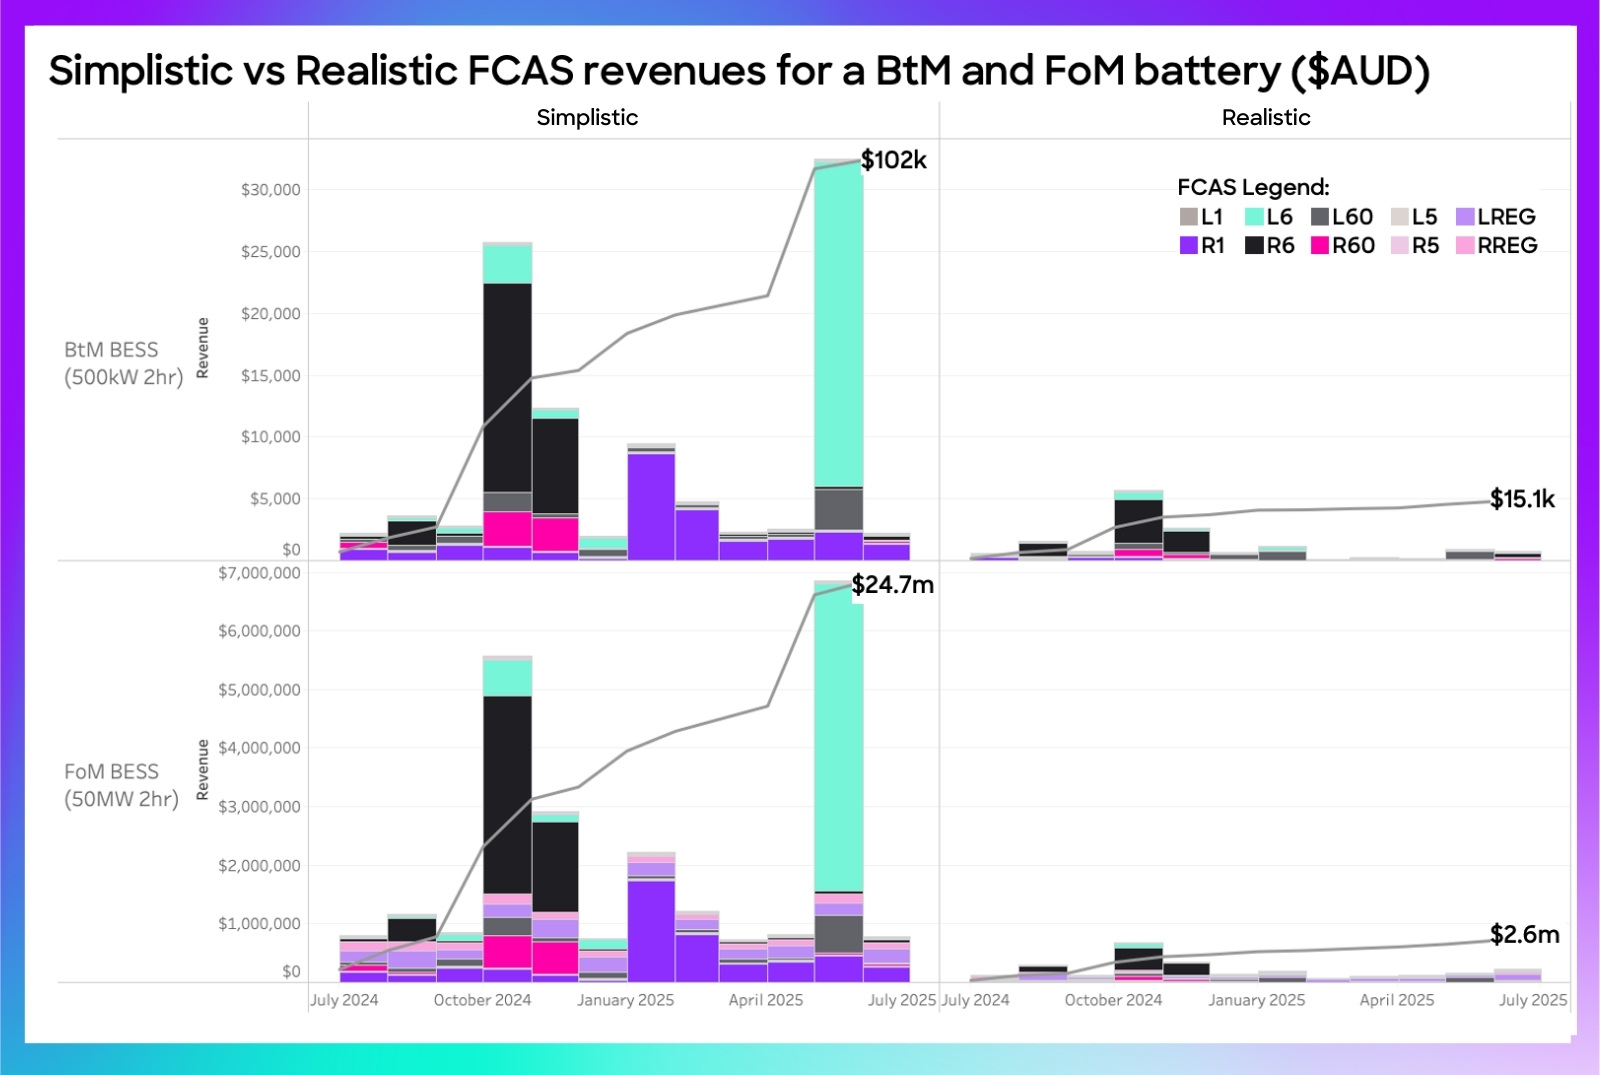
The simplistic model is based on CY2024 price data, because in the customer example I referred to earlier, this was the data they had available. This is significant because 2024 is when the new very fast FCAS services were launched, which had very high pricing initially but which was quickly saturated.
The realistic model used up-to-date price data based on an automated feed with AEMO, the system operator (but obviously alternative long-term price forecasts could also be used). It also includes all of the considerations mentioned above, using default settings benchmarked against real assets in the market.
In these models the utility-scale project earned 9.5X more FCAS revenue than the more realistic model, and the behind the meter project earned 12.3X more. So getting the details right is very significant.
What Frequency Performance Payments (FPP) Mean for Battery Storage
If the NEM’s FCAS market services have declining value, what about the new Frequency Performance Payments (FPP) regulation? Does it represent a lucrative new value stream for flexible assets?
As we noted when asked for comment by Renew Economy when the new regulation was launched at the start of June, we didn’t expect FPP to meaningfully influence project developer decisions because most generator and storage income depends on energy prices, not ancillary services.
“Batteries will be the net winners of the new regulation, but it’s not going to change the fact that the vast bulking of the value captured by batteries will come from energy price arbitrage.”
This was borne out in the data when AEMO released the Quarterly Dynamics report for Q2 2025, with details on the first (almost) full month of operations of FPP. There were only a negligible $3.6 m of FPP incentive payments in June across the whole NEM (with $1.4 m coming from 12 June when reg‑FCAS marginal cost spiked).
This is insignificantly tiny in comparison to the size of physical spot market for energy.
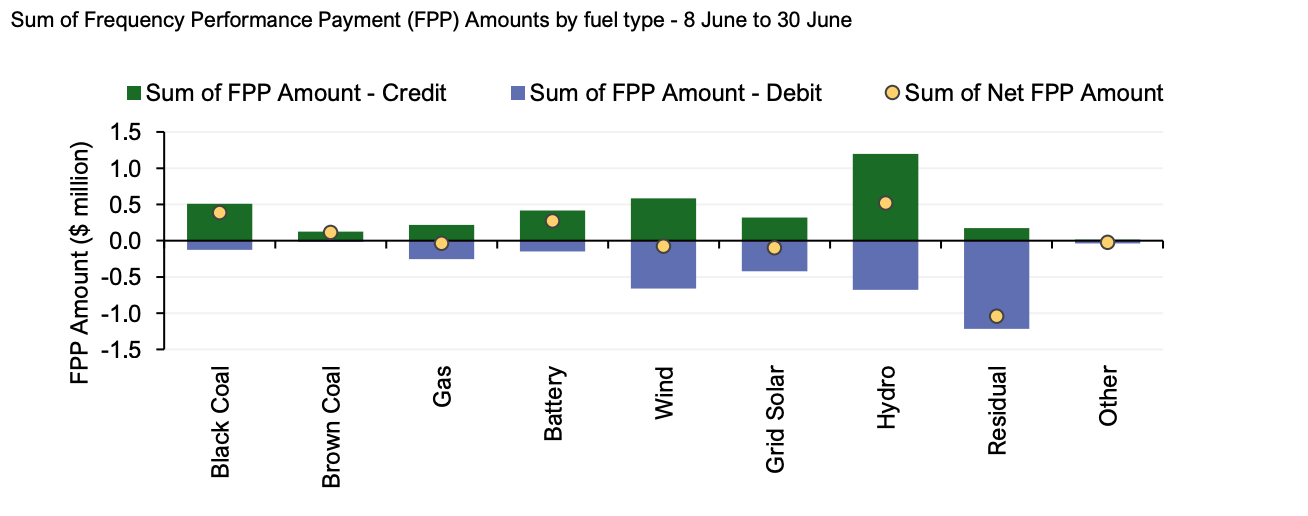
As a reminder, FPP is not a market ancillary service, but a settlement adjustments in the NEM that reward or penalise enabled FCAS providers based on how well their response actually supports system frequency, replacing the old FCAS causer pays regulation.
Will FPP Create a New Revenue Stream for Batteries?
While FPP adds a layer of incentives for performance, the data so far suggests its impact is minimal compared to the much larger revenue opportunities from energy price arbitrage. Developers should be cautious about over-estimating its role in project feasibility.
Takeaways for Battery Developers and Investors
- FCAS markets are shallow and easily saturated — early mover advantages won’t last.
- Naive feasibility studies can significantly overstate ancillary revenues.
- Realistic modelling requires co-optimisation and detailed assumptions.
- FPP is unlikely to replace declining FCAS revenues as a major value stream.
Don’t leave your project’s future to optimistic forecasts. Contact us today for data-driven BESS revenue modelling you can trust.